Every plan comes with your own company AI, from day one. See what it does

See how the week went without asking for a report

Get clear answers without adding work for your team. Performance, attendance and workload come from what they already record, in the same definitions on every screen.

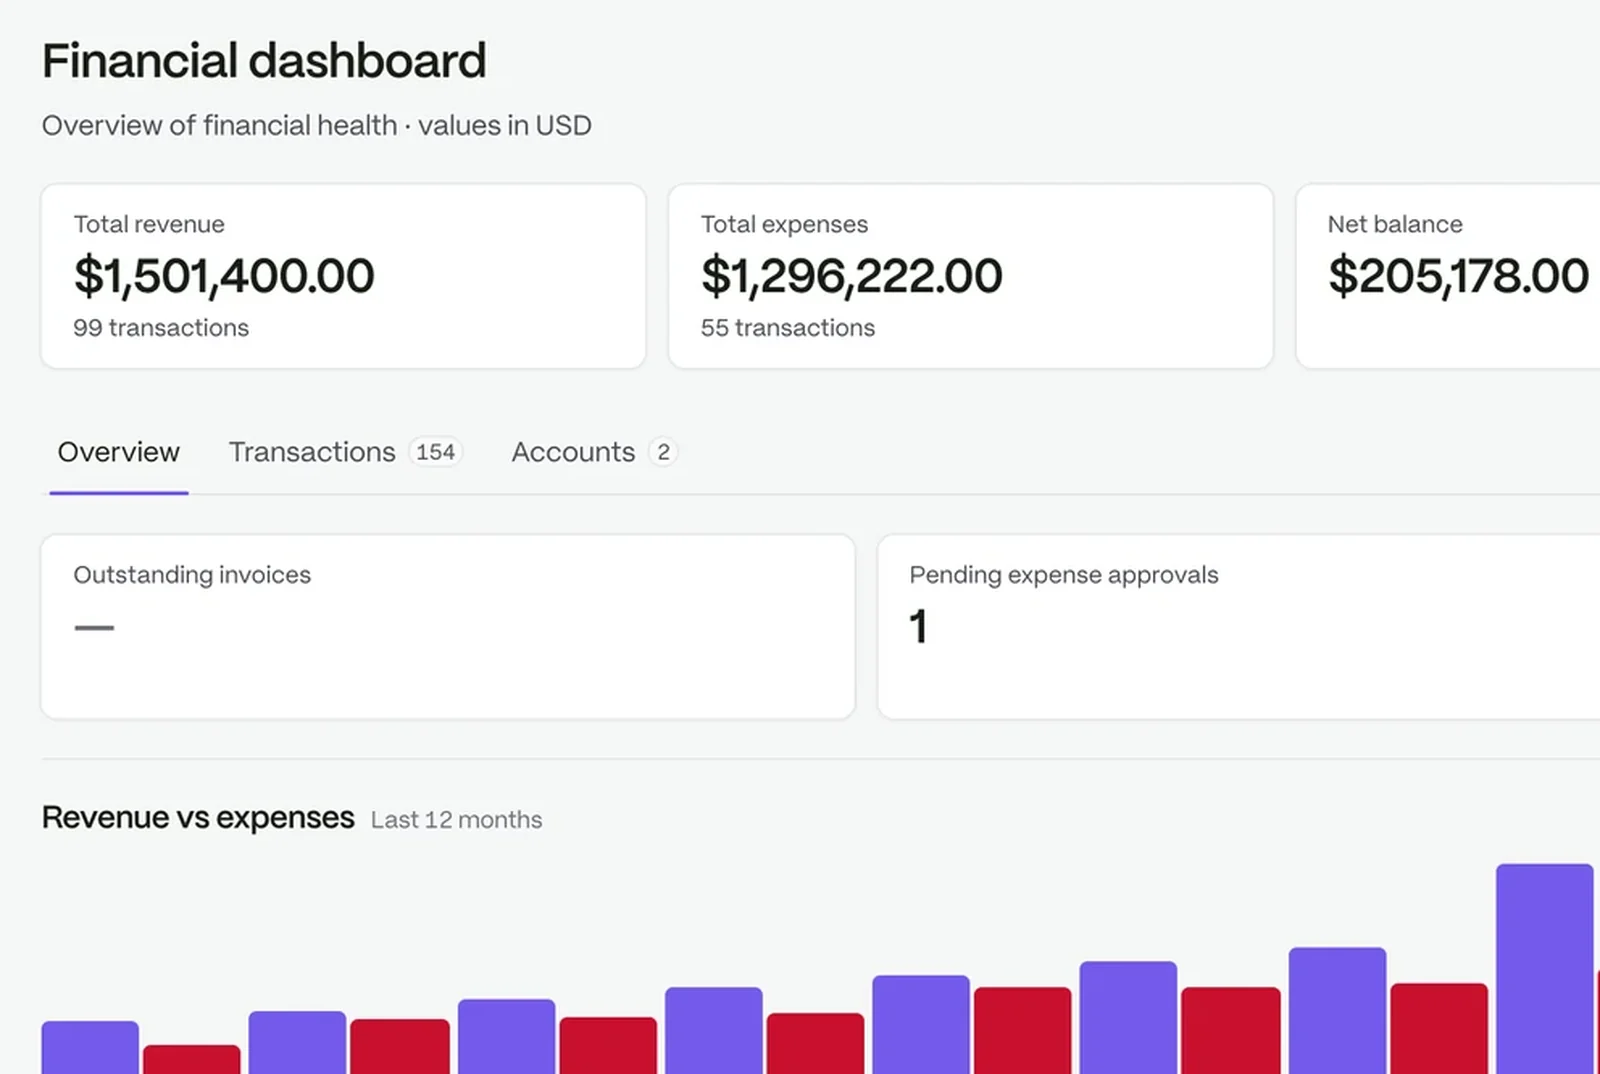
A financial dashboard: revenue, expenses, net balance and twelve months of cash flow

Answers come from the work itself

  1. 01

    Your team works as normal

    Clock-ins, tasks and logged time build up on their own as people do their jobs.

  2. 02

    Open the report

    See which departments are ahead and who needs attention, for a week or a month.

  3. 03

    Follow up

    Go from the summary to the people and records behind it.

Know which team needs help

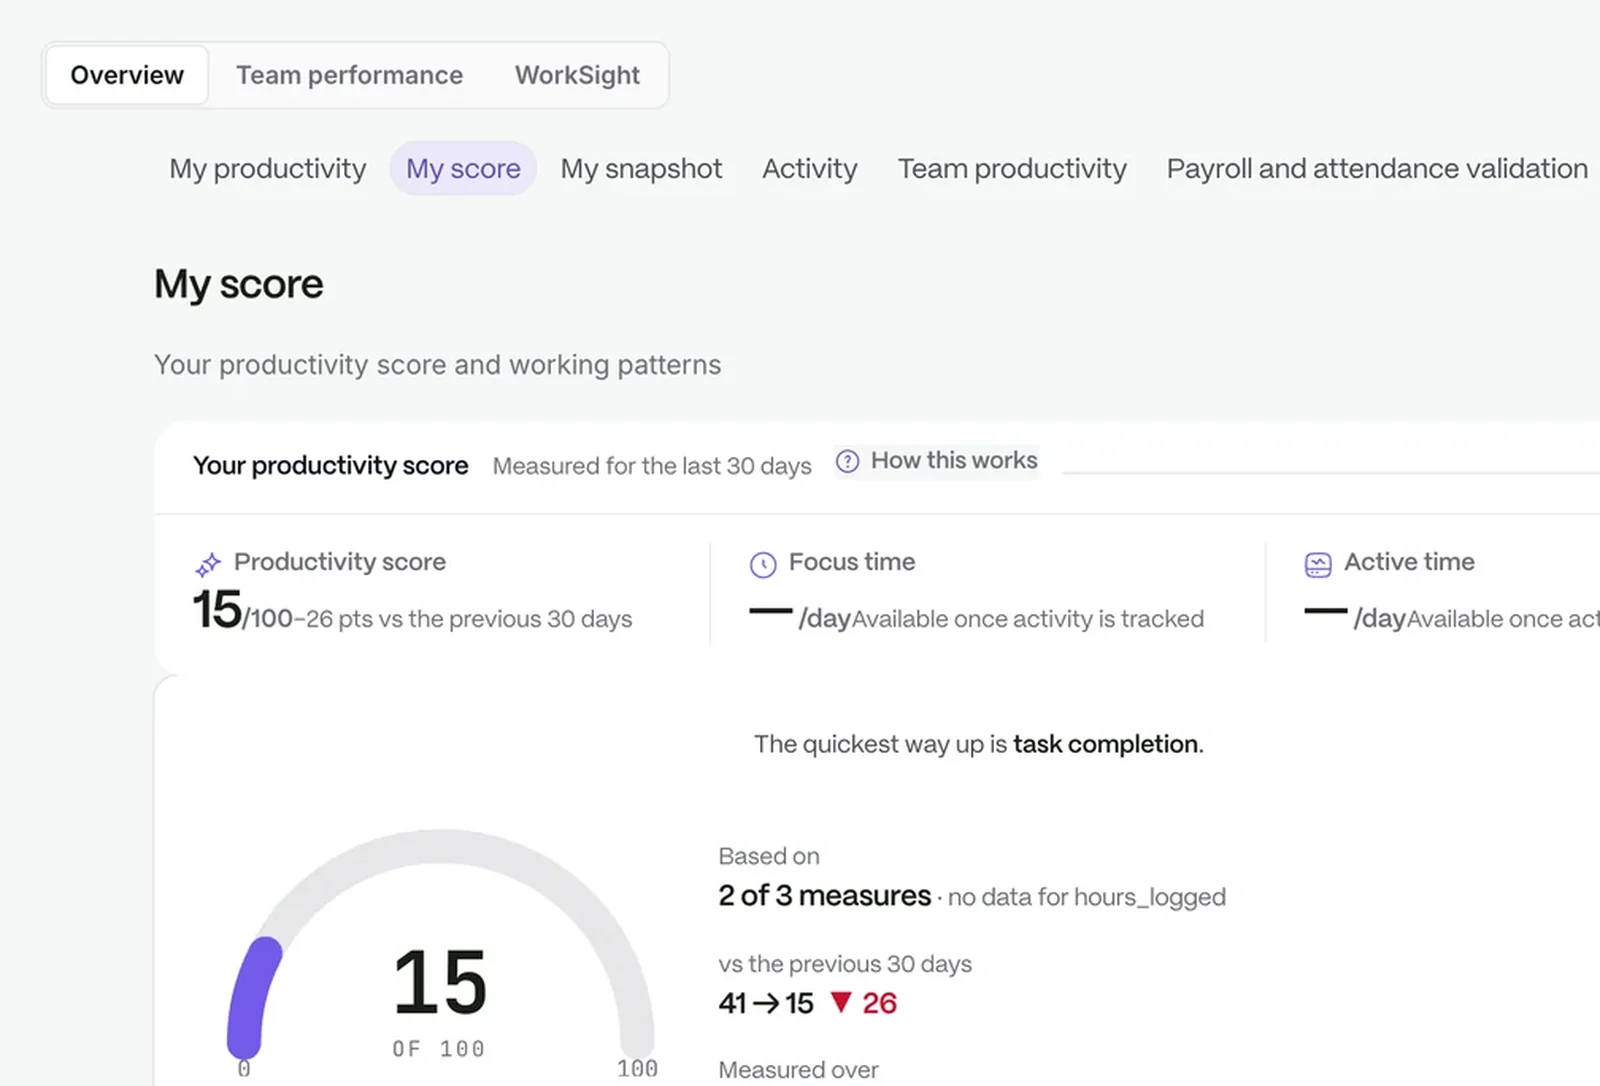
See where to step in. Departments are ranked by efficiency, and opening one shows utilization, completion and the members ranked beneath it.

  • Efficiency on a 0 to 100 scale
  • Utilization means logged hours against worked hours
  • Members ranked within each department
A productivity score with focus time, active time and goal attainment

Catch overload while it can still be fixed

Four lists show who is doing well, who needs attention, who is overloaded and who has been idle, drawn from tasks and logged time.

  • Top Performers, Needs Attention, Overloaded Staff and Idle Staff
  • Task counts and completion, not impressions
  • Weekly or monthly
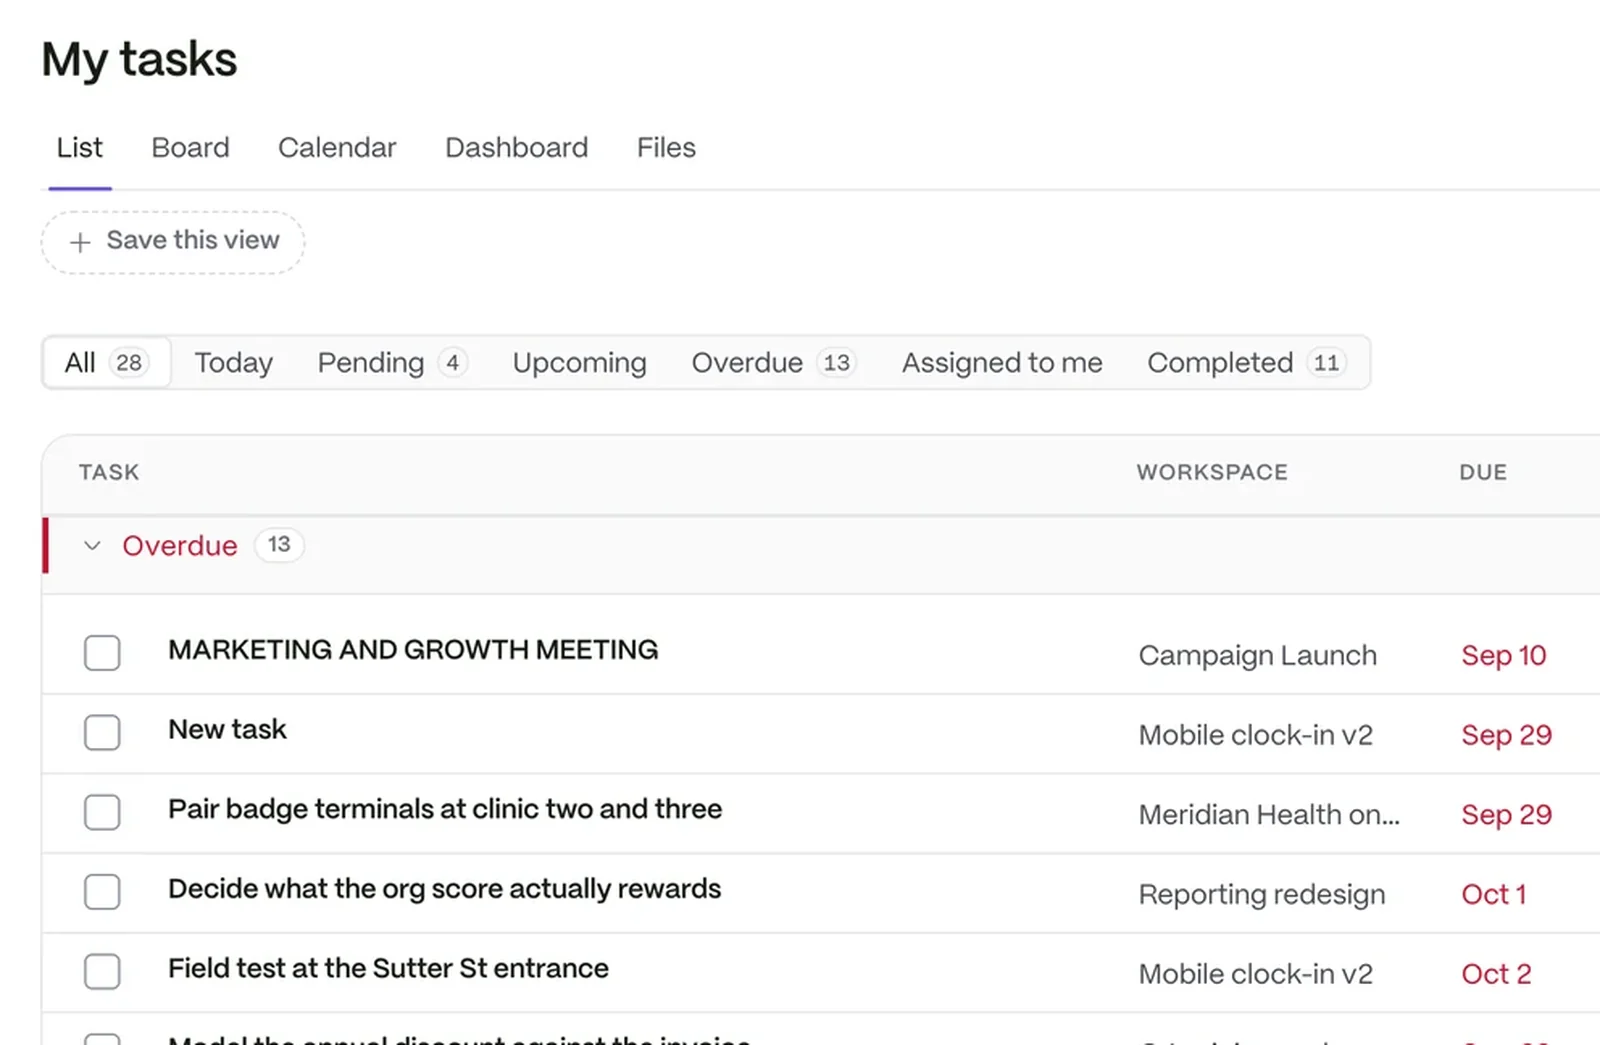
A task list showing each task’s workspace, due date, priority and who it is assigned to

Every number traces back to real work

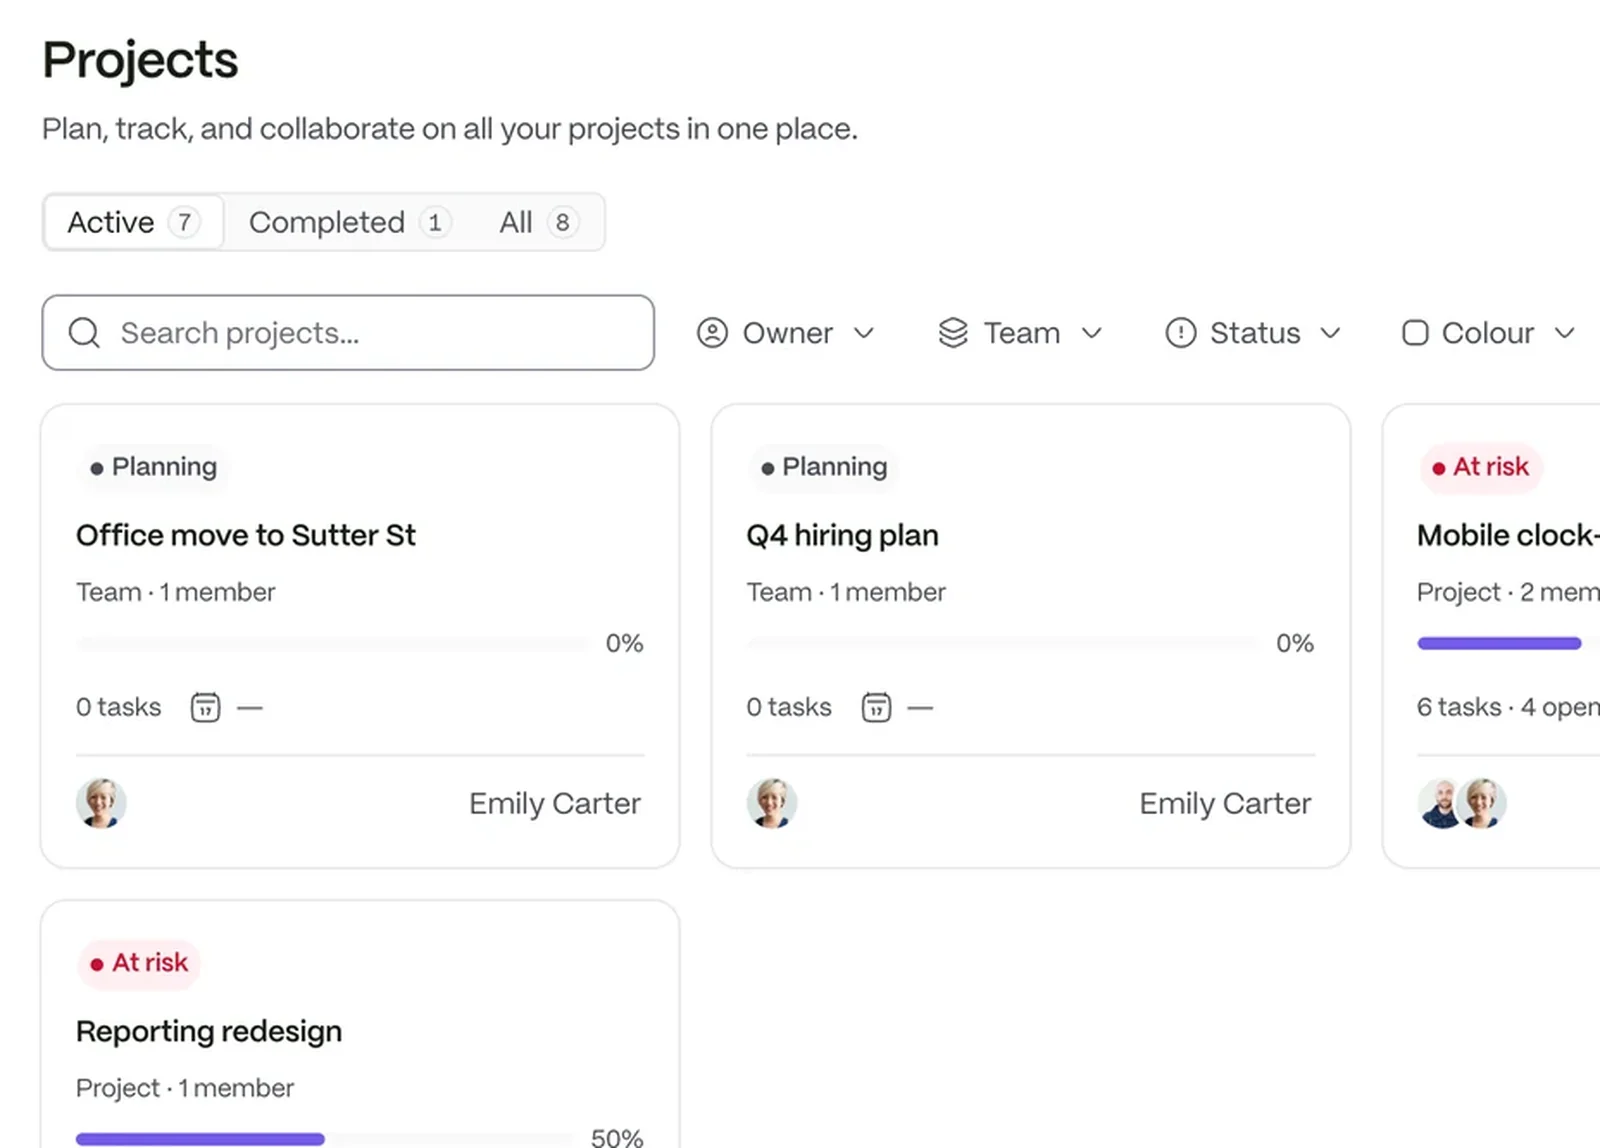
Trust the numbers because you can see the work. Tasks and work logs sit in one place, for yourself, for everyone, or for the unassigned work nobody owns yet.

  • List, Board, Calendar and Dashboard views
  • Hours by teammate, by workspace and by task
  • Work log entries can be written when a task is completed
The projects board: each project with its tasks, how far along it is and who owns it

One version of last month’s hours

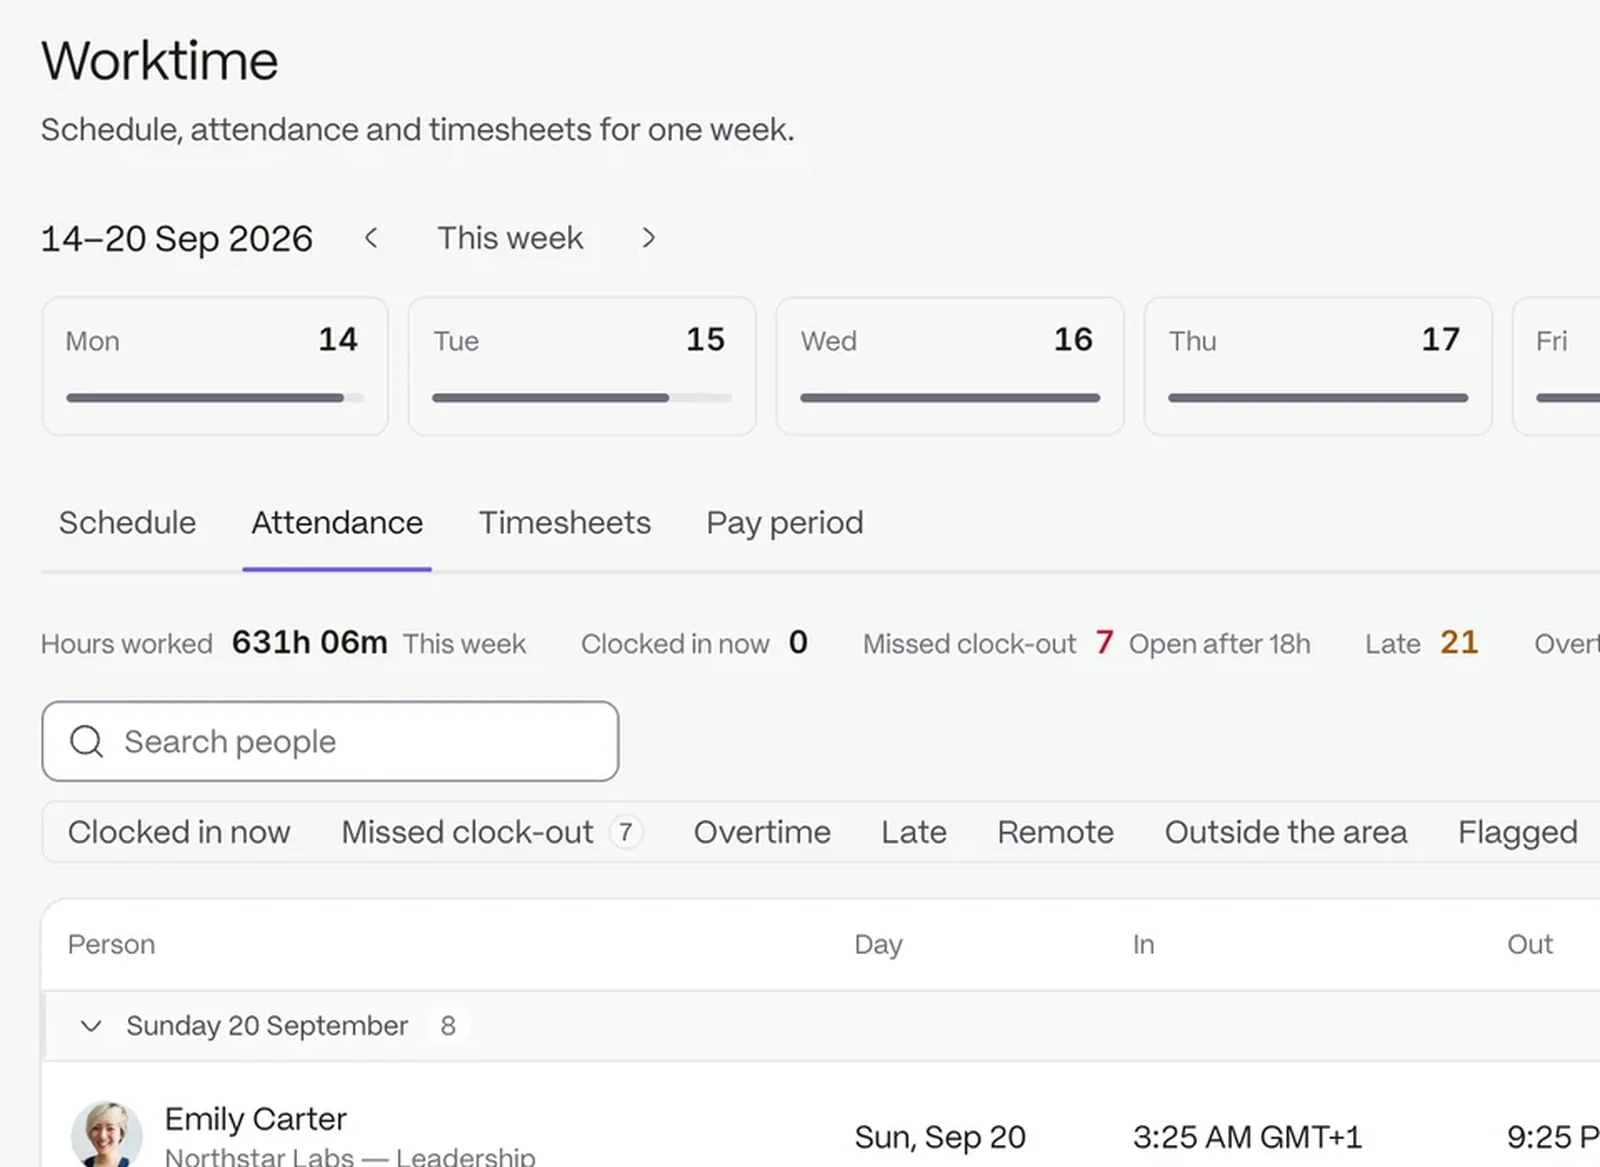
Settle any question about hours in one look. The attendance summary gives days worked, total hours, average per day and late count for each person over any date range.

  • A totals line across the organization
  • Take it with you as a file, with the columns you choose
  • Built from the clock events behind it
See time and attendance
Attendance records and totals for a date range

Clear answers for the people who decide

Ask how the week went

Your company AI answers from your own records and documents, inside the permissions each person already has. It is included in every plan.

Questions people ask

Where do the numbers come from?

From tasks, logged time and clock events your team already records.

Can I see just one department?

Yes. Open any department to see its score and the members ranked within it.

Can I export the results?

The attendance summary exports to a file, with the columns you choose.

See the organization as it runs

Start a free trial, or book a demo and see it with your own setup.